The context tape
Read this if you need to teach, debug, or audit where an agent’s context budget actually went. You’ll be able to render the same tape from a canned scenario, a real trajectory, or an RSI journal, then compare the reused prefix against fresh input and decode without hand-drawing a new chart.
fak’s most-shared picture is one panel of the live demo (cmd/ctxdemo): a row per agent,
each row a horizontal bar whose coloured segments are drawn to scale — the shared
prefix, the model’s decode, and every tool result a different size. You can see the context
grow unevenly, and you can see how little of it is new each step. That single image explains,
in one glance, why a multi-agent fleet stresses the KV cache and where fak’s reuse win comes
from.
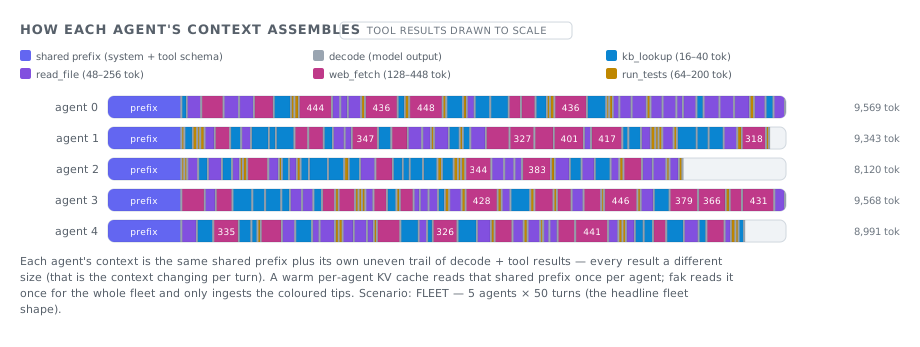
The trouble was that this picture lived only inside one running Go HTTP demo, drawn in
browser JavaScript, fed by five synthetic scenarios. You could not point it at a real
session, you could not emit it from another part of the system, and you could not drop it
into a doc. This note is about the small tool that fixes all three —
tools/context_tape.py — and the program it opens up:
more of this kind of visual, everywhere a human reads.
One renderer, many sources
The move is to make the data portable, not the demo. Every producer emits the same tiny, source-agnostic Tape JSON, and one renderer turns any Tape into the picture above:
{
  "title": "How each agent's context assembles",
  "tag": "tool results drawn to scale",
  "legend": [{"key": "prefix", "label": "shared prefix"}, {"key": "read_file", "label": "read_file (48–256 tok)"}],
  "rows": [
    {"label": "agent 0", "total_label": "9,569 tok",
     "segments": [{"key": "prefix", "value": 1024}, {"key": "read_file", "value": 201}]}
  ],
  "caption": "…"
}
That Tape is the whole interface. The renderer knows nothing about agents, turns, or
caches — it draws labelled rows of coloured, to-scale segments and a legend. So any data
source that can describe itself as rows-of-segments gets the same picture for free. The tool
ships three such adapters today, and the schema is the seam where the fourth plugs in. Each
adapter writes a standalone SVG (no server, no JS), an HTML page, an ASCII twin for a
terminal or a Jekyll-served doc, or the raw Tape JSON:
python tools/context_tape.py scenario   fleet-5x50            --svg fleet.svg
python tools/context_tape.py trajectory  session.jsonl        --svg session.svg
python tools/context_tape.py rsi         rsiloop-journal.jsonl --ascii
python tools/context_tape.py render      tape.json             --html out.html
Application 1 — live for any trajectory
Point the trajectory adapter at a real Claude Code session transcript — the same .jsonl
cmd/fak/sessionaudit.go reads — and it renders that
session’s context tape. Each row is one billed turn; the bands are exact provider token
counts from message.usage: the big faded band is the prefix the model reused from
cache that turn (cache_read), the small coloured tip is the fresh input that turn
(input + cache_creation), and the grey tail is decode (output). Billed turns are de-duped
on message.id exactly the way session_audit.py folds them (Claude Code writes several
transcript lines per billed turn).
HOW THIS SESSION'S CONTEXT ASSEMBLES   [real trajectory · drawn to scale]
legend: ▒ reused prefix (KV cache hit · cache_read)  ░ decode  a Read  b Grep  c Edit  d Bash

turn 1 │aaaaaaaaaaaaaaaaaaaaaaaaaaaaaaa░                                    │ 5,400 in
turn 2 │▒▒▒▒▒▒▒▒▒▒▒▒▒▒▒▒▒▒▒▒▒▒▒▒▒▒bbbbbbb░                                  │ 5,560 in
turn 3 │▒▒▒▒▒▒▒▒▒▒▒▒▒▒▒▒▒▒▒▒▒▒▒▒▒▒▒▒▒▒▒▒▒aaa░                               │ 6,140 in
turn 4 │▒▒▒▒▒▒▒▒▒▒▒▒▒▒▒▒▒▒▒▒▒▒▒▒▒▒▒▒▒▒▒▒▒▒▒▒ccccccccccc░░░                  │ 8,130 in
turn 5 │▒▒▒▒▒▒▒▒▒▒▒▒▒▒▒▒▒▒▒▒▒▒▒▒▒▒▒▒▒▒▒▒▒▒▒▒▒▒▒▒▒▒▒▒▒▒▒▒ddddd░░             │ 9,025 in
turn 8 │▒▒▒▒▒▒▒▒▒▒▒▒▒▒▒▒▒▒▒▒▒▒▒▒▒▒▒▒▒▒▒▒▒▒▒▒▒▒▒▒▒▒▒▒▒▒▒▒▒▒▒▒▒▒▒▒▒▒cccccccc░░│ 11,312 in
The reused band dwarfing the fresh tip is the frozen-trajectory OBSERVED provider-cache
cost/latency rebate — but now on your session, not a synthetic one. It is the
per-turn, drawn-to-scale companion to the
aggregate numbers in cmd/fak/sessionaudit.go and the survival
curves in cache_curve.py: the
frozen-trajectory cache cliff made visible turn by turn.
python tools/session_audit.py discover --since-days 7        # find a real session .jsonl
python tools/context_tape.py trajectory <that-session>.jsonl --svg my-session.svg
Application 2 — RSI loops, and similar, modularly
Because the renderer only knows about rows-of-segments, a producer that is not a context
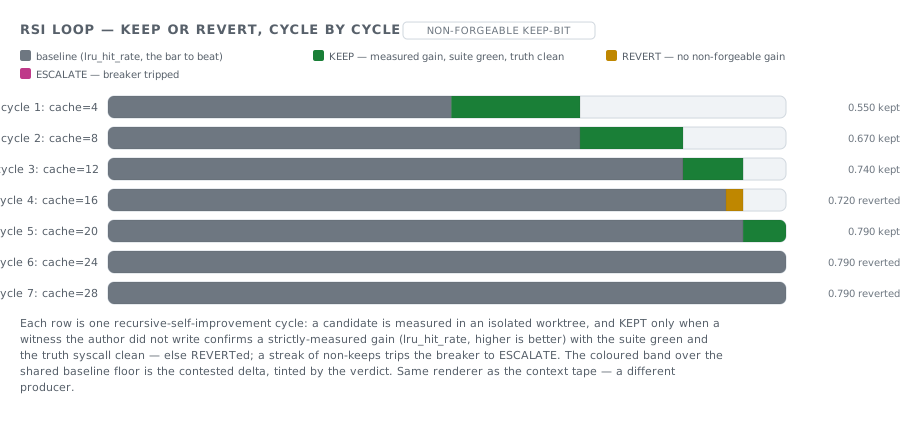
trace at all gets the same picture. The RSI loop (internal/rsiloop)
writes an append-only keep/revert journal; the rsi adapter renders it as a verdict
ladder — one row per cycle, the bar the candidate metric over a shared baseline floor, the
contested delta tinted by the verdict (keep / revert / escalate).
RSI LOOP — KEEP OR REVERT, CYCLE BY CYCLE   [non-forgeable keep-bit]
legend: ░ baseline (the bar to beat)  █ KEEP  ▓ REVERT  ▚ ESCALATE

 cycle 1: cache=4 │░░░░░░░░░░░░░░░░░░░░░░░░░░░░░███████████                 │ 0.550 kept
 cycle 2: cache=8 │░░░░░░░░░░░░░░░░░░░░░░░░░░░░░░░░░░░░░░░░█████████        │ 0.670 kept
cycle 3: cache=12 │░░░░░░░░░░░░░░░░░░░░░░░░░░░░░░░░░░░░░░░░░░░░░░░░█████    │ 0.740 kept
cycle 4: cache=16 │░░░░░░░░░░░░░░░░░░░░░░░░░░░░░░░░░░░░░░░░░░░░░░░░░░░░▓    │ 0.720 reverted
cycle 5: cache=20 │░░░░░░░░░░░░░░░░░░░░░░░░░░░░░░░░░░░░░░░░░░░░░░░░░░░░░████│ 0.790 kept
This is the “more modular” point made concrete: the loop did not learn to draw, and the
renderer did not learn about RSI — they meet at the Tape schema. A loop run can emit a ladder
SVG as a build artifact the way it already emits a dos improve --observe receipt
(the Observer seam), so a human reviewing a self-
improvement run sees the keeps and reverts at a glance instead of reading a JSONL. The next
producer — a fleet’s per-agent token budget, a benchmark’s arm-by-arm cost, a policy’s
allow/deny mix — is one Tape-emitting function away, with no renderer change.
Application 3 — education and course material
Because every adapter emits a standalone SVG and an ASCII twin, the same explanatory visual can live wherever a human reads — not only on a running demo:
- A README or GitHub page embeds the SVG directly (
). - A Jekyll-served
docs/page uses the ASCII fence (renders identically everywhere, no mermaid plugin needed) or embeds the SVG image. - The learning path can illustrate the cache courses with a real picture: FAK 201 (what a KV cache is), FAK 401 (how agents stress it), and FAK 402 (the A/B/C cost arms) are exactly the concepts the tape draws. A course lab becomes “render your own session and read the reused band,” which is a far better checkpoint than a paragraph.
The teaching value is that the picture is honest and reproducible: a student can run the exact command, get the exact figure, and change one input (more agents, a longer trajectory, a flexible vs append-only harness) to watch the reuse move. That is the difference between a diagram a human drew and a diagram the data drew.
The visuals-everywhere program
The tape is the first instance of a general principle worth pursuing across the repo:
Every fak data source that has a shape should be able to draw that shape, in the same visual language, with no custom rendering code.
The repo already has two visual families: the hand-authored mermaid deck in
visuals/ (architecture diagrams, edited via _meta.json) and the
generated charts from tools/*_gen.py and cache_curve.py. The context tape adds a third,
more reusable kind: a renderer keyed on a portable data model, so the work of making a
new visual is the work of describing the data, not drawing it. Concrete next steps that
follow this principle:
- Unify the live demo and the static export. Teach
cmd/ctxdemoto emit aTapeJSON (a ~20-line addition next to its existing-print -json), so the interactive panel and the checked-in SVG render from one schema and can never drift. - Turn the trajectory tape into a meter. The bands are already exact; folding a per-turn longest-common-prefix divergence (the flexibility survival factor from FAK 401) onto each row would make the cache cliff falsifiable on a live workload, exactly the meter that note asks for.
- More producers. A fleet budget tape, a benchmark cost-arm tape, a policy
allow/deny tape — each a small
Tape-emitting function reusing this renderer. - A gallery. A short generated page that renders one example per producer, so the visual language is discoverable in one place.
Honest fences
- Exact where it can be, attributed where it can’t. A trajectory’s band sizes are exact
provider token counts (
cache_read,input + cache_creation,output). The colour of the fresh band is the turn’s dominant tool name — an attribution of an exact-size band, not a per-tool token re-measurement. The legend saysfresh input · <tool>to keep that honest. - The scenario is synthetic. The
scenarioshapes are a faithful Python mirror of the Go catalog incmd/ctxdemo/scenario.go(same seeded LCG). The mirror is cross-checked byte-for-byte againstgo run ./cmd/ctxdemo -print -json(all five scenarios, results and tool names) and the parity is locked by a test; pass--from-json <(go run ./cmd/ctxdemo -print -json)to render from the authoritative numbers directly. - Drawn to scale means within one tape. Segment widths are proportional to token counts inside a single figure; two different figures are not necessarily on the same scale.
- The committed SVGs are examples.
visuals/66is the synthetic headline scenario;visuals/67is an illustrative RSI journal (a representative shape, not a recorded run). Render the real ones from your own session / journal with the commands above. A real session’s SVG is not committed — it is yours to generate, and it may carry tool names from your work, so treat it like any session artifact.
Reproduce it
python tools/context_tape.py list                              # the scenario catalog
python tools/context_tape.py scenario fleet-5x50 --ascii       # the headline panel, in your terminal
python tools/context_tape.py scenario fleet-5x50 --svg fleet.svg
python tools/context_tape.py trajectory <session>.jsonl --svg session.svg   # YOUR session
python tools/context_tape.py rsi <rsiloop-journal>.jsonl --svg ladder.svg
python -m pytest tools/context_tape_test.py -q                 # parity + exact-band tests
Related: frozen-trajectory-cache-cliff.md (why the
reused band is so big, and the scaling laws that shrink it) ·
kv-cache-agentic-context.md (the prefix mechanics) ·
cmd/fak/sessionaudit.go (the exact token accounting the
trajectory tape reads) · cmd/ctxdemo (the live, interactive sibling).