Benchmarking Documentation Index
Quick link: The single source of truth for all benchmark numbers is
fak/BENCHMARK-AUTHORITY.md. Every claim traces back to a commit and artifact file. Start there for authoritative numbers.
Want to run them yourself? The fleet benchmark suite explainer walks through the five model-agnostic fleet demos (
fanbench,fleetbench,fak turntax,radixbench,ctxdemo) with one reproduce command each — no GPU, no model weights, no API key — and the honest baseline for every headline number.
This index organizes all benchmark-related documentation across the repo.
flowchart TD
    AUTH["BENCHMARK-AUTHORITY.md<br/>single source of truth"]
    READ["How to read these benchmarks<br/>baselines, measured vs modeled"]
    PRIMARY["Primary Results (measured)<br/>session value, RadixAttention, safety"]
    SECONDARY["Secondary Results (measured)<br/>fan-out, fleet read-heavy"]
    METHOD["Methodology<br/>scaling laws, KV cache, production"]
    INFRA["Benchmark Infrastructure<br/>demorace, core benches, sweeps"]
    GOV["Governance Process<br/>DOS-centric verification"]
    REPRO["Contribute / Reproduce<br/>sessionbench, radixbench"]
    AUTH --> READ
    AUTH --> PRIMARY
    AUTH --> SECONDARY
    AUTH --> METHOD
    AUTH --> INFRA
    AUTH --> GOV
    AUTH --> REPRO
Every claim in this index traces back to BENCHMARK-AUTHORITY.md.
How to read these benchmarks
Understanding the baselines
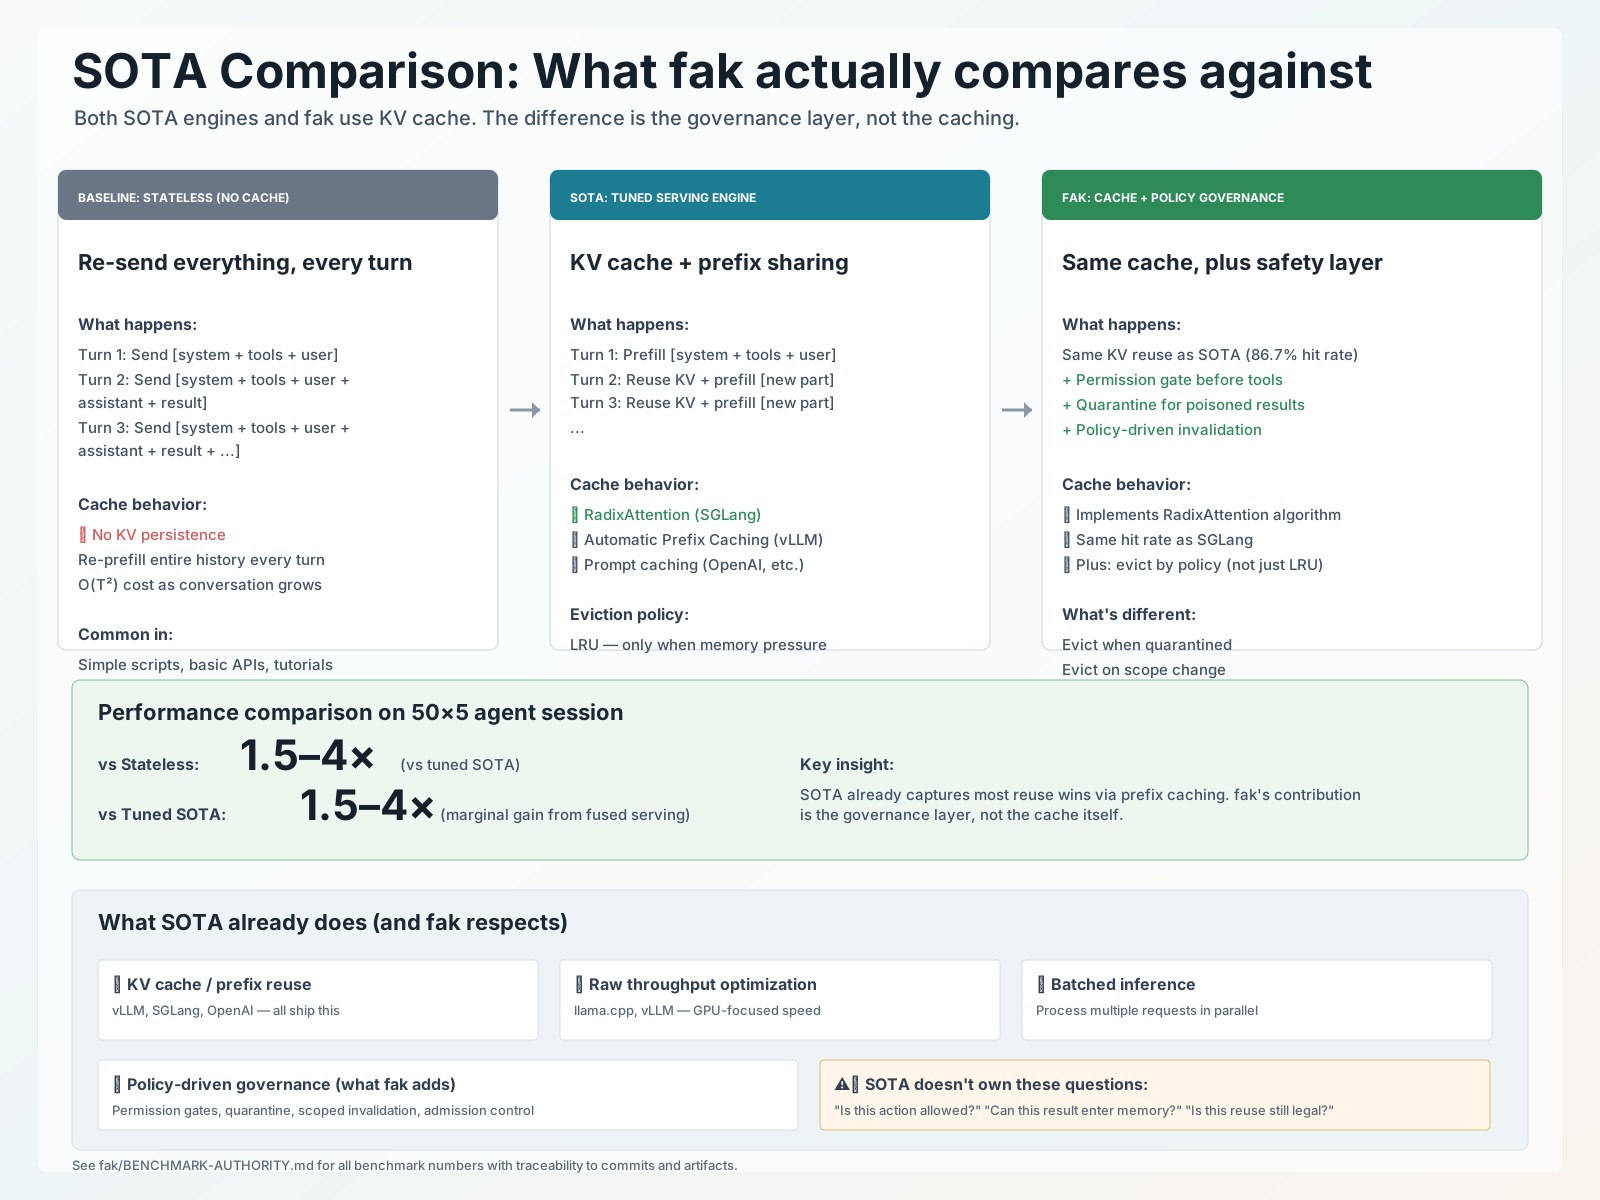
When we say “60× faster” or similar, the baseline matters:
| Baseline | What it means | Where this appears in practice |
|---|---|---|
| Naive stateless | Re-send full conversation every turn, no KV persistence | Scripts, simple APIs, tutorials |
| Tuned SOTA | Per-agent KV cache, prefix sharing (vLLM, SGLang, etc.) | Production serving stacks |
| Raw throughput | Tokens per second (llama.cpp, vLLM) | GPU engine comparisons |
Key fact: Both SOTA engines and fak use KV cache. The performance difference vs
SOTA is a few-fold. The 60× figure is only vs the naive stateless pattern.
See visuals/45-sota-comparison-naive-vs-tuned-vs-kernel.svg
for a visual comparison.
Measured vs. Modeled
- Measured: Actual runs with committed artifacts and traceability
- Modeled/Projected: Extrapolations from measured rates, clearly labeled
- Frontier targets: Design directions, not shipped claims
All measured claims in fak/BENCHMARK-AUTHORITY.md.
Primary Results (Measured)
Session Value Stack
What: Multi-turn, multi-agent session efficiency
Result: ~4.1× vs a tuned warm per-agent KV cache (the realistic SOTA) on a 50-turn × 5-agent session. (The ≈60× figure is only vs a naive re-prefill-every-turn loop — a worst-case floor no serving stack ships, not the SOTA comparison.)
Baseline: Tuned warm per-agent KV cache (the SOTA); naive stateless shown only as the worst-case floor
Details: SESSION-VALUE-STACK-DECK.md (private companion — see Authority below)
Authority: fak/BENCHMARK-AUTHORITY.md → “Session value-add”
RadixAttention Cache Parity
What: KV cache hit rate comparison with SGLang’s RadixAttention
Result: 86.7% hit rate on agents workload (inside SGLang’s 50–99% band)
Baseline: SGLang published results
Details: RADIXATTENTION-RESULTS.md (private companion — see Authority below)
Authority: fak/BENCHMARK-AUTHORITY.md → “RadixAttention Results”
Safety / Injection Resistance
What: Prompt injection resistance on real models
Result: 5/5 injections reached unprotected baseline; 0/5 reached fak
Baseline: Unmediated tool calls
Details: LIVE-RESULTS.md (private companion — see Authority below)
Authority: See SECURITY section in fak/BENCHMARK-AUTHORITY.md
Secondary Results (Measured)
Fan-out Benchmark
What: N=1…1024 sub-agents with shared prefix ladder
Result: Scaling behavior across agent counts
Details: FANOUT-BENCH-RESULTS.md (detailed write-up not yet public)
Fleet Read-heavy Projection
What: Cross-agent shared-read optimization
Result: 2,344/2,500 duplicate tool calls deleted
Details: FLEET-VALUE-PROJECTION.md (detailed write-up not yet public)
Methodology
General Benchmark Approach
docs/notes/SCALING-LAWS-OF-AGENTS-2026-06-19.md
- Scaling thesis for agent systems
- Why agents scale differently from chat
- Saturation points and measurement needs
KV Cache in Agentic Context
docs/explainers/kv-cache-agentic-context.md
- How KV cache works with tool use
- What actually erodes hit rate (not tool output itself!)
- Why cache matters more for agents than chat
Production Benchmark Methodology
docs/production-benchmark-methodology.md
- How session benchmarks are structured
- What the arms measure (naive vs tuned vs fused)
RadixAttention Explainer
RADIXATTENTION-EXPLAINER.md (private companion)
- First-principles walkthrough of RadixAttention
- How the benchmark works
Benchmark Infrastructure
Date: 2026-06-19 Status: Live demo working, sweep abstraction shipped
Overview
The fleet repo has comprehensive benchmarking infrastructure for measuring LLM serving performance across multiple axes:
- Live Demo (cmd/demorace) — HTTP-accessible head-to-head race showing ~7-13× speedup from cross-agent prefix reuse + batched decode
- Core Benchmarks — Go/Python tools for latency, throughput, and fleet-scale simulations
- Sweep Abstraction — YAML-configurable multi-model sweeps
- External Tools — Separate repos for cache benchmarking (Bench) and context retrieval (ContextBench)
1. Live Demo: cmd/demorace
What it does: Runs a live HTTP-accessible race between “naive” (re-prefill every turn) and “fak” (reuse + batched decode) arms.
Location: fak/cmd/demorace/
Build: go build -o demorace.exe ./cmd/demorace
Run: ./demorace.exe -addr 127.0.0.1:8147
Access: http://127.0.0.1:8147
Measured Results (SmolLM2-135M)
| Metric | fak (fused) | naive (re-prefill) |
|---|---|---|
| Total time | 90.18s | 779.91s |
| Prefill tokens | 1,152 | 15,200 |
| Decode tokens | 400 | 400 |
| Speedup | 6.82× | — |
API Endpoints
GET /— Embedded HTML dashboardGET /api/ladder— List available modelsGET /api/race?model=...&P=...— Run live race (SSE stream)GET /api/curve— Build reuse curve across model ladder (SSE stream)
2. Core Benchmarks (Go)
| Tool | Purpose |
|---|---|
sessionbench |
Multi-agent session value stack (3 arms) |
modelbench |
Forward pass latency (f32/Q8_0/Metal/GGUF) |
batchbench |
Multi-user batched decode throughput |
fleetbench |
2-D turn-tax sweep (turns × agents) |
fleetserve |
Cross-agent shared-prefix fleet workload |
radixbench |
RadixAttention prefix-cache vs SGLang |
3. Sweep Abstraction
Location: tools/
Purpose: Extract sweep configuration from monolithic scripts into reusable YAML profiles
Usage
# List available profiles
python tools/run_sweep.py --list

# Run quick smoke test
python tools/run_sweep.py --profile quick-smoke

# Custom run with overrides
python tools/run_sweep.py --profile quick-smoke --trials 5 --models glm-4.7-flash
4. External Benchmark Folders
Bench (Cache Benchmarking)
Location: Separate repo Purpose: N-Server Cache Benchmarking
- Supports: SGLang, vLLM, llama.cpp
- Features: Cache layer detection, L3/CXL tuning
ContextBench (Academic Context Retrieval)
Location: Separate repo Purpose: Code agent context retrieval benchmark
- Research: Nanjing University + UCL
- Dataset: 1,136 tasks from 66 repos, 8 languages
Hardware / Environment
Reference Hardware
- Session benchmark: Apple M3 Pro
- Model: Qwen2.5-1.5B (varies by benchmark)
- Full details: In each benchmark’s own document
Cross-Platform Reproducibility
RadixAttention hit rates reproduce bit-for-bit across platforms (Windows x86_64 vs Mac
M3 arm64). See CROSS-PLATFORM-REPRO-20260619.md (private companion).
Governance Process
DOS-Centric Verification
- How benchmark claims are created, verified, and published
- The discipline that ensures traceability
DOS Verification Commands
dos_commit_audit— Verify commit diff matches claimdos verify— Confirm a phase actually shipped- See DOS plugin documentation for details
Visual Aids
| Visual | Shows | Location |
|---|---|---|
| 41-performance-spectrum.svg | Performance from parity to frontier | visuals/ |
| 42-agent-scaling-laws.svg | Scaling multipliers and saturation points | visuals/ |
| 44-agent-frontier-spectrum-data-chart.svg | Calculated frontier workload data | visuals/ |
| 45-sota-comparison-naive-vs-tuned-vs-kernel.svg | What “naive” means vs SOTA vs fak | visuals/ |
| 46-two-gate-security-model.svg | Security architecture comparison | visuals/ |
Contribute / Reproduce
Reproduce Session Benchmark
go run ./cmd/sessionbench \
  -turns 8,16,32 -agents 4 -prefix 512 -decode 24 -result 48 \
  -out experiments/session/smoke.json
Reproduce RadixAttention Benchmark
go run ./cmd/radixbench \
  -dir internal/model/.cache/smollm2-135m \
  -quant \
  -out experiments/radixattention/radixbench-smollm2-135m-q8.json
See fak/BENCHMARK-AUTHORITY.md → “Reproduce” section.
FAQ
Q: Is the 60× vs SOTA or vs naive? A: vs naive (no KV persistence). vs tuned SOTA, the gain is 1.5–4×. This is disclosed in every benchmark.
Q: Does fak use KV cache like SGLang? A: Yes. fak implements the same RadixAttention algorithm and achieves comparable hit rates (86.7% vs SGLang’s 50–99% band). The difference is policy-driven governance, not caching.
Q: Are the power/energy numbers measured? A: No, they’re simulated. There’s no power meter on the benchmark hardware. All power/kWh/tokens-per-watt figures are illustrative, not measured.
Q: What about the 10k × 10k agent city? A: That’s a frontier design target, not a shipped benchmark. It’s used to illustrate where the scaling laws lead, not to claim measured performance.
Last updated: 2026-06-19